The comic book market finally can be tracked by its own data-driven index, courtesy of GoCollect.
Introduced last month, GoCollect’s Collectible Price Index (CPI) tracks the performance of various eras and segments of the comic book market — from the Golden Age to the Modern Age. Additionally, the platform has created a “Big Spenders Club” index, which tracks the most valuable comic books.
The CPI will do for comics what platforms such as Card Ladder and Alt have done for trading cards.
Each index is made up of a basket of comics from the category which are indicative of broader market trends. The weekly value of the index is calculated using an aggregate of the sales averages of those books.
This value is then divided by a flexible variable (the “divisor”) meant to account for the various discrepancies between the lower-priced books and the more expensive copies.
Using this data, let’s take a look at the trends in market value for comic books over five eras of history (Golden Age, 1938 to August 1956; Silver Age, September 1956 to August 1970; Bronze Age, September 1970 to March 1984; Copper Age, April 1984 to December 1993 and the Modern Age, January 1994 to present) and evaluate the state of the comic book market segments over three different time periods and see how they stack up since the index began tracking in 2015.
Since 2015 (January 2015 to June 2024)
- Golden Age: 72.6%
- Silver Age: 156%
- Bronze Age: 230%
- Copper Age: 151%
- Modern Age: 132%
- Big Spenders Club: 109%
Last five years
- Golden Age: 32.4%
- Silver Age: 46.6%
- Bronze Age: 83.5%
- Copper Age: 72.1%
- Modern Age: 41.7%
- Big Spenders Club: 55.1%
Last year
- Golden Age: 6.78%
- Silver Age: -8.89%
- Bronze Age: -9.11%
- Copper Age: -17.2%
- Modern Age: -16.5%
- Big Spenders Club: 1.19%
But let’s dig a bit deeper behind the numbers.
The most glaring piece of data is the largely negative performance over the past year for all segments other than the Golden Age and the Big Spenders Club. Zooming out, those same sectors are also the two with the least substantial gains since 2015.
So what does that tell us?
Slow and steady wins the race when it comes to the high-end comics.
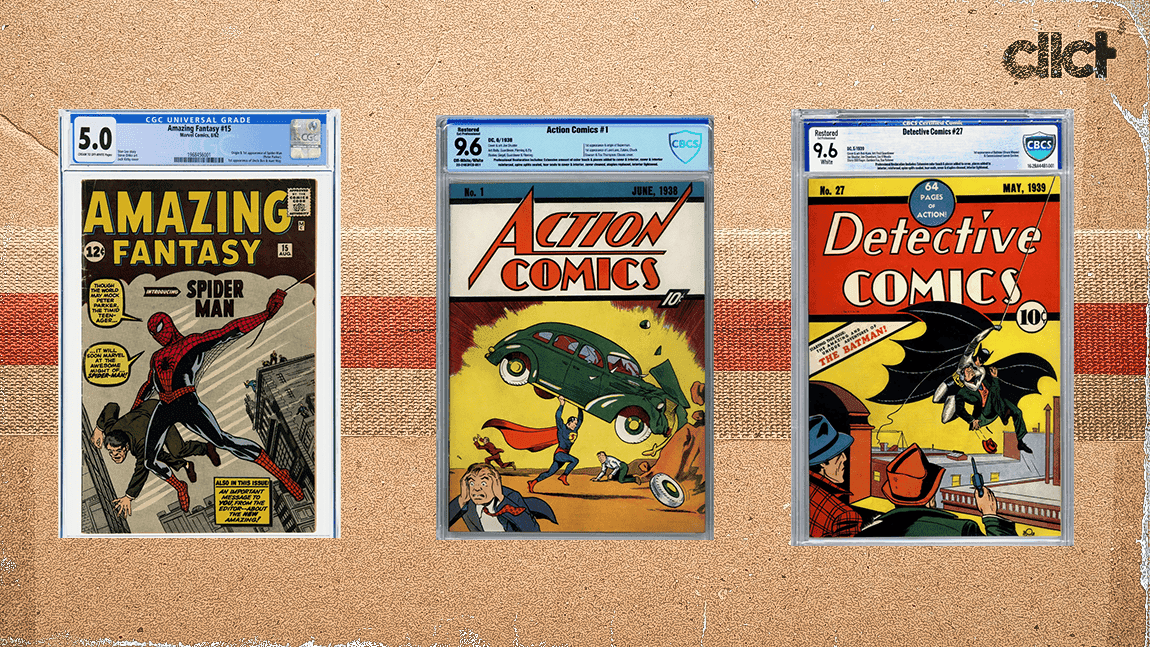
Of course, the Big Spenders Club, which includes books such as Action Comics #1 (first appearance of Superman), Detective Comics #27 (first appearance of Batman) and Batman #1, among 34 of the most valuable titles, is by definition high-end.
However, considering the age of Golden Age comics, which encompasses other key titles from the era, like Wonder Woman #1, Archie Comics #1 and Green Lantern #1, the segment is not exactly budget-friendly in its own right.

Based on the smooth and relatively unwavering gains of these two indices, far less affected by the COVID spike than their peers, it proves the comparatively safe nature of these markets.
"As you look on each index, you see the explosive trend in comics settle more and more the further back you go, ultimately ending with the Golden Age demonstrating incredible staying power in value," GoCollect's Wymon Stanlick told cllct. "This perhaps showcases more than just a comic becoming iconic with age, but also the simple fact that there just aren't as many new books popping up on the census to be fought over. And hence the value continues to climb."
Anecdotally, it makes sense. After all, if a collector is shelling out $1 million on a comic book, it’s more likely they have a longer investment horizon, due not only to the cost of the investment, but also due to the rarity of the book, as the illiquidity of these markets make it much more difficult to exit and re-enter at one’s leisure.
Who knows the next time that high-grade key comic will come back up for sale when there are only a dozen to begin with?
Now, with respect to the remaining four indices, a few themes emerge.
In the realm of Modern Age comics, the impressive 132 percent gain since 2015 comes to a screeching halt in the past year, as the index returned -16.5 percent.

A similar story can be told for Copper Age and Bronze Age comics, which posted appreciation of 151 percent and 230 percent, respectively, since 2015, only to find the past year to be a decline of -17.2% and -9.11%.
The five year charts for the Silver Age, Bronze Age, Copper Age and Modern Age all show the same trend: A surge into all-time highs between May 2021 and September 2022 — when the collectibles market writ large was frothy, flush with cash and a seemingly endless supply of collectors were willing to pay higher and higher prices regardless of historical price data.
From those highs, each of those indices witnessed a pronounced decline. While still staying in the green over the long-term, the downward spiral has been rather violent.
"It's obvious that the Modern market was overachieving by enormous gains, and that the corrections we see on the Modern CPI are going to continue for some time," Stanlick said. "I think that index especially is indicative of every element we saw throughout the recent collectibles boom — new investors and collectors spending more free time and their disposable income during a decent economy. And as time goes on, we'll see population numbers on the graded census continue to climb which will only hurt certain books from this era even greater."
For many of the same reasons the Golden Age and Big Spenders Club owe their gentle but reliable upward trajectory, these eras have been faced with the other side of the coin, as the lower prices made the markets more susceptible to a bubble and a mass exit on the way down.
Card collectors should be familiar with this sort of trend, albeit, the indices shake out slightly differently.
The Card Ladder Vintage index gained more than 460 percent since 2015, peaking around the same time as other collectibles but ultimately ending up only a bit below those COVID highs. Not unlike the Golden Age index.
On the other hand, the Card Ladder Modern index enjoyed a gain of nearly 790 percent over the time period, yet has had a far more difficult time recovering to COVID highs, still sitting at less than half the high watermark established during that period.
Where the card market indices differ, however, is in the past year, where the vintage index has fallen 18.72 percent compared to less than 9 percent for the modern index.
An important caveat here is that, unlike the Big Spenders Club and Golden Age CPIs, the Vintage index is far less skewed toward the most valuable cards. While the most expensive cards, such as the $12.6 million 1952 Topps Mickey Mantle SGC 9.5, are included, cards such as the 1979 Willie McCovey Topps Raw are too, which is valued at under $1.
It’s not apples to apples by any stretch of the imagination.
It’s therefore necessary to include Card Ladder’s High-End index, which only includes cards with last sales of $5,000 and above, for additional context. Here we see a 685 percent growth over the same time period, outpacing the Vintage index but still behind the Modern, as well as a -14.73 percent decline in the past year.
Similarly to the Vintage index, we see a clear fall from COVID highs, but still less pronounced than the Modern index.
Again it’s cards to comics, not apples to apples, but the more data the better.
While nothing fits into a perfectly round peg, it seems broadly true to note that vintage and high-end comics (as well as cards) have managed to navigate the post-COVID collectible markets in far calmer waters than more modern or less expensive sectors.
As mentioned above, this is a likely result of longer holding periods, the steeper investment costs — which forces one to look at these collectibles as financial assets with longer horizons rather than quick flips — as well as the rarity and longevity of the relevant components.
Rarity causes friction at the point of sale due to the lack of guarantee collectors will be able to soon replace the comic or card, whereas the longevity and track record of the sectors seem to have a calming effect on the market, considering the longer and more robust data set providing evidence of long-term returns.
Will Stern is a reporter and editor for cllct.